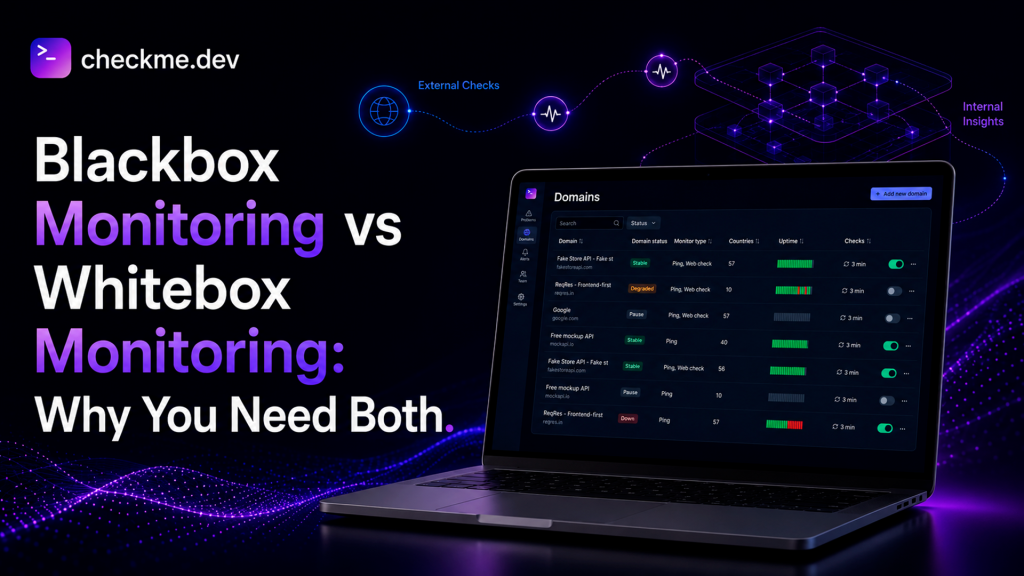
Blackbox and whitebox monitoring comparison with external probes, metrics, logs, traces, and infrastructure signals

Blackbox Monitoring vs Whitebox Monitoring: Why You Need Both

Blackbox Monitoring vs Whitebox Monitoring: Why You Need Both Blackbox monitoring answers the question your users care about first: can they actually reach and use the service right now? Whitebox monitoring answers a different question: what is happening inside the systems you operate? Those perspectives are complementary. A dashboard can show healthy CPU, memory, queues, […]

Blackbox Monitoring vs Whitebox Monitoring: Why You Need Both Read Post »
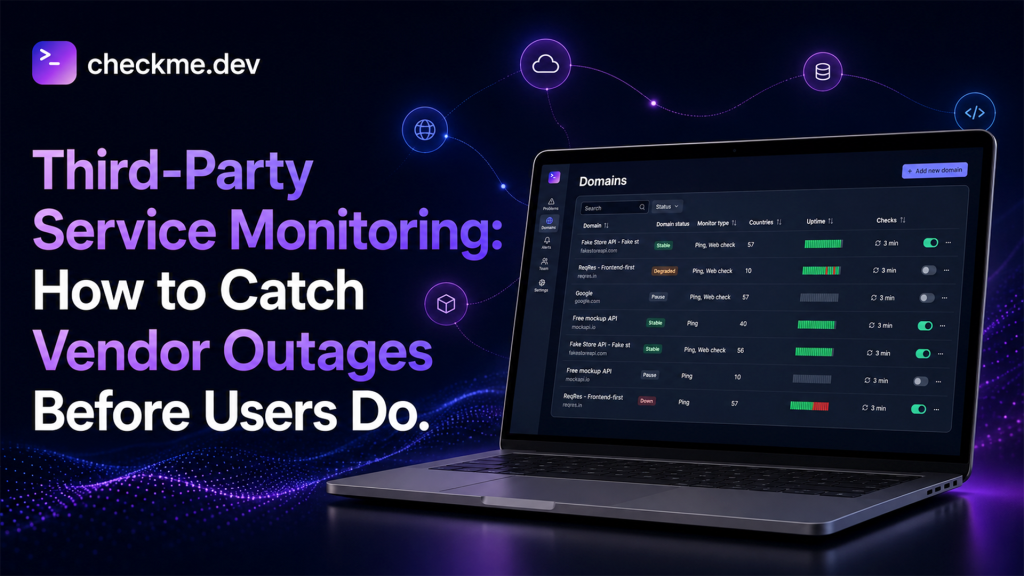
Third-Party Service Monitoring and Vendor Outages

Third-Party Service Monitoring: How to Catch Vendor Outages Before Users Do

Third-Party Service Monitoring: How to Catch Vendor Outages Before Users Do Third-party service monitoring is the practice of checking the external services your product depends on before their failures become indistinguishable from your own. Payment gateways, identity providers, CDN services, DNS providers, messaging platforms, verification APIs, analytics endpoints, and SaaS integrations can all sit directly

Third-Party Service Monitoring: How to Catch Vendor Outages Before Users Do Read Post »

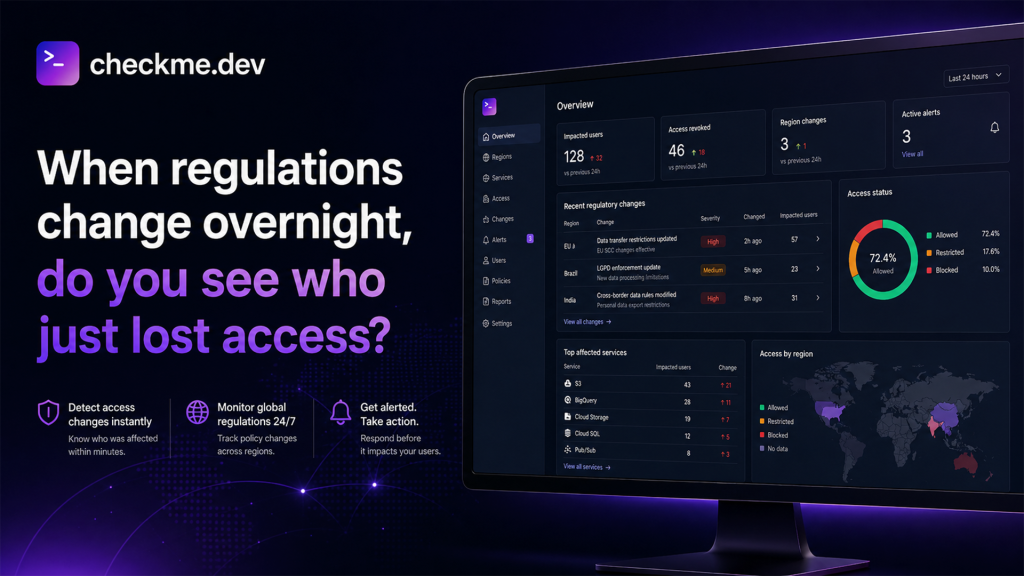
Website availability by country dashboard showing regional access restrictions and ISP-level failures

Website Availability by Country: When Regulations Change Overnight, Who Loses Access?

Website Availability by Country: When Regulations Change Overnight, Who Loses Access? A service can be fully operational at the origin and still disappear for users in an entire country. The application is healthy, the CDN dashboard is green, and the usual uptime probe returns HTTP 200. Yet local users see timeouts, DNS errors, connection resets,

Website Availability by Country: When Regulations Change Overnight, Who Loses Access? Read Post »

Synthetic monitoring correlation dashboard showing probes, logs, and RUM data in unified incident view

Synthetic Monitoring Correlation: 5 Ways to Unite Probes, Logs & RUM

Introduction Synthetic monitoring correlation is the practice of connecting data from geo-distributed probes, backend logs, and real user analytics into a single, actionable incident timeline. Without proper synthetic monitoring correlation, these three data sources live in silos: synthetic checks tell you when something should be wrong, logs and traces tell you what actually is wrong,

Synthetic Monitoring Correlation: 5 Ways to Unite Probes, Logs & RUM Read Post »

API monitoring strategy dashboard showing endpoint health and latency across regions

Beyond “Is It Up?”: Building an API Monitoring Strategy on Top of Website Uptime

API Monitoring Strategy: 5 Steps to Extend Website Uptime Checks Introduction Most teams start with simple HTTP uptime checks for their marketing site and main app. But as soon as you rely on APIs—public or internal—for logins, payments, or mobile apps, a green “website is up” light can become dangeringly misleading. Traditional API uptime monitoring

Beyond “Is It Up?”: Building an API Monitoring Strategy on Top of Website Uptime Read Post »

Scroll to Top

Contact checkme.dev team

Fill out the form, and we will be in touch shortly

Your Contact Information
How can we help?